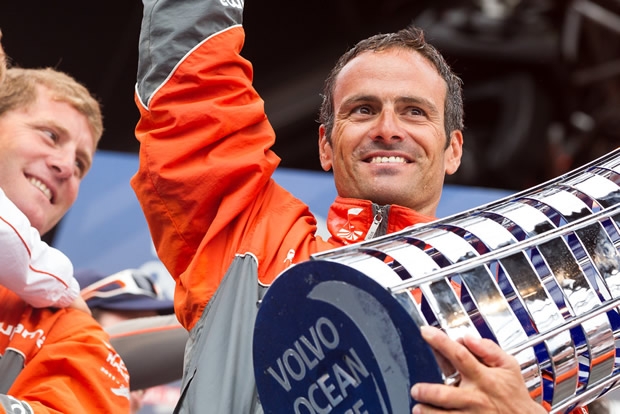
Some impressive stats from the Volvo Ocean Race
Multimedia material produced by the Volvo Ocean Race's on board MCMs, plus a clear focus on news production and distribution helped the 2011-12 edition deliver a surge in audience across platforms, figures in the end of race report show.
The multimedia reporters embedded in each of the six teams provided regular feeds of HD video, including live calls streamed from the boats via the Inmarsat satellite network, as well as still images, audio clips and written reports to give a thrilling view of the closest race in the 39-year history of the Volvo Ocean Race.
Headlines from the report, released to the media exactly one year after the start of the race on October 29 2011, include:
42% increase in hours of TV broadcast around the world compared to 2008-09 – resulting in a 16 percent increase in cumulative TV audience (see note 1)
47.6% increase in TV news audience thanks to a focus on high-value broadcasters and news agencies (1)
94.8% increase in online articles published about the race (2)
More than 8 million views on the race's official YouTube channel (3)
6.27 million unique visitors to volvooceanrace.com bringing 127 million page views – more than double the page views from the 2008-09 race (4)
2.9 million visitors to the Race Villages – with an average crowd of 43,882 on In-Port Race days (5)
23,486 corporate guests attending over the course of the race (5)
Number one sailing property on Facebook with over 200,000 fans (6)
More than 16 million visits and 244 million page views to the Race Tracker – a 67.3% increase in visits and seven times the number of page views (7)
"These numbers demonstrate that not only was 2011-12 the closest race in the history of our event but also a huge success commercially," said Volvo Ocean Race CEO Knut Frostad. "More fans than ever followed the racing across our multimedia platforms, almost three million people came to the stopovers and over 20,000 corporate guests came to experience the event for themselves. The guest experience has been developed a lot with pro-am racing in all ports as well as more attractions in and around the race villages.
"The Media Crew Members' performance took a big step forward and they sent back more content with higher quality than ever before, much of it going straight into news reports on some of the world's biggest TV and digital platforms. No other top-flight sporting event has anything like the MCM programme, with embedded reporters sending back such thrilling HD content direct from the front line."
The multimedia content was also introduced in new formats, such as the 3D Cinema in the Race Villages. In total, attractions at the Race Villages drew 692,000 visitors along a route that took the race across five continents, with stops in Spain, South Africa, Abu Dhabi, China, New Zealand, Brazil, the United States, Portugal, France and Ireland.
"The Volvo Ocean Race pulled in a total of 2.9 million spectators during the event," said Volvo Ocean Race Chief Operating Officer Tom Touber. "To put that into perspective, the Euro 2012 soccer championship attracted 1.5 million."
Frostad added: "We visited China for the second time in 2011-12 and made a real breakthrough with a first visit to the Middle East with what was a spectacular stop in Abu Dhabi. Going forward, we will continue to take this unique human and sporting challenge out to an audience that is truly global."
Growth in TV, online, print and social media was underpinned by unparalleled news coverage, with organisers working closely with major distribution platforms to push the story as widely as possible.
In a sign of the growing shift in the way content is consumed, media value was for the first time higher from online sources than from print, with both platforms showing significant growth.
Pictures and videos were particularly popular as drivers of engagement on Facebook, with the fan base growing from around 40,000 at the start of the race to over 200,000 by the end.
IFM/SMS who compiled this data, monitored 15 territories throughout the period October 10, 2011-July 20, 2012: Brazil, China, France, Germany, Ireland, Italy, Netherlands, New Zealand, Portugal, South Africa, Spain, Sweden, United Arab Emirates, United Kingdom, United States. Total cumulative TV audience for 2011-12 was 1.55 billion, based on 8,969 broadcasts.
YouTube Analytics over October 10, 2011-July 20, 2012 indicated a total number of views in the race period was 8,009,085, against 1,060,973 in 2008-09 – an increase of 654.9%.
Google Analytics October 10, 2011-July 20, 2012 whoed the Race and Game websites together had a total of 63 million visits and 187 million page views.
According to Géovoile the 31 May arrival into Lisbon pulled in 200,816 visits to the Tracker and a record 7,894,980 page views.


Latest Comments
Mike Stannard 29/10/2012 - 14:32
Jerry, Pretty sure they're talking about spectators i.e. people actually attending the venues rather than viewers on the box... makes sense that way and pretty impressive too I'd say. Great work by all involved! Mike S.jerryhill 29/10/2012 - 13:50
So the Volvo Ocean Race got nearly twice the number of viewers than Euro 2012 Soccer champs (2.9 million vs 1.5 million).......is this just the usual spurious ways of presenting data, or are we really expected to believe that?!Add a comment - Members log in